1. 원본 데이터 요청 폼
https://upwell.pfeg.noaa.gov/erddap/griddap/nasa_jpl_dde5_3be1_897b.html
NOAA(미국국립해양대기청)에서 제공하는 해수면 온도(SST) 데이터이다. 3일전 데이터부터 가져올 수 있다.
2. 제주도 부근 데이터 URL기반으로 얻기
nc 형식의 해수면 표면 온도 데이터를 요청하는 url은 다음과 같다.
https://upwell.pfeg.noaa.gov/erddap/griddap/nasa_jpl_dde5_3be1_897b.nc?
analysed_sst[(시작날짜):(종료날짜)]
[(북):(남)][(서):(동)] //북위+ 남위- 서경- 동경+
&.draw=surface
&.vars=longitude|latitude|analysed_sst
&.colorBar=KT_thermal|D|Linear|15|18|6
&.land=over&.bgColor=0xffccccff

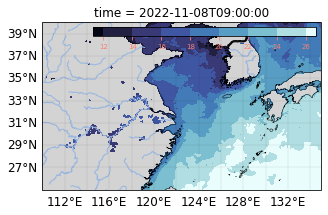
2022년11월8일의 제주도 부근의 바다 데이터를 가져오는 url
.nc 확장자로 다운받아진다.
url 날짜를 바꿔서 다운로드를 요청하는 스크립트를 만들고 매일 반복 실행하면 최신 데이터를 얻어올 수 있을 것이다. 귀찮아서 생략.
3. 파이썬으로 데이터 시각화
#코랩 기준

#모듈 설치
!pip install cartopy
!pip install cmocean
!pip install pyproj

#드라이브 마운트
from google.colab import drive
drive.mount('/content/gdrive')

#모듈 임포트
import matplotlib.pyplot as plt
import matplotlib.ticker as mticker
from matplotlib.pyplot import tick_params
# from matplotlib.font_manager import get_fontconfig_fonts
from datetime import datetime
import cartopy.crs as ccrs
import cartopy.feature as cfeature
import cmocean as cmo
import numpy as np
import pandas as pd
import xarray as xr
import os
from pyproj import transform

f = "lateset_MUR_SST_Ko_Jeju.nc" #다운 받은 nc 파일이름
datadir = ("/content/gdrive/My Drive/noaa") #nc 파일 경로
d = datadir + "/" + f
ds = xr.open_dataset(d)

# open single variables in the xarray dataset
# sst_3d = ds["analysed_sst"] + 273.15
sst_3d = ds["analysed_sst"]

#2차원배열로 압축하기
sst = sst_3d.squeeze()

# Generate figure (set its size (width, height) in inches).
fig = plt.figure(figsize=(5, 8))
ax = plt.subplot(1, 1, 1, projection=ccrs.PlateCarree())
ax.coastlines(linewidths=0.5)
ax.add_feature(cfeature.LAND, facecolor="lightgray")
ax.add_feature(cfeature.BORDERS)
ax.add_feature(cfeature.RIVERS)

# get the min, max for SST, convert to a scalar, and round off
varmin = sst.min()
sstmin = int(round(varmin.item(),0))
varmax = sst.max()
sstmax = int(round(varmax.item(),0))
sst_int = int(sstmax - sstmin)
if sst_int >=6:
    contour_levels = np.array(range(sstmin,sstmax,2))
elif sst_int <6:
    contour_levels = np.array(range(sstmin,sstmax,1))

"""
만약 여기서 에러나는 경우
날짜 범위를 2일 이상으로 했는지 확인
시작날짜 = 종료 날짜 같아야함. 만약 다르면 배열이 3차원이 되어버려서 에러가 남
"""
pt_sst = sst.plot.contourf(ax=ax,
    transform=ccrs.PlateCarree(),
    levels=contour_levels,
    cmap=cmo.cm.ice,
    add_colorbar=False,
    zorder=0,
)

# color bar
from mpl_toolkits.axes_grid1.inset_locator import inset_axes
cax = inset_axes(ax,
    width="80%",  # width = 80% of parent_bbox width
    height="5%",  # height : 5%
    loc='upper right',
)

# axins1.gridlines(draw_labels=False)
cbar = plt.colorbar(pt_sst,
    cax=cax,
    orientation="horizontal",
    extendrect=True,
)

cbar.ax.tick_params(labelsize=7, colors='salmon')
gl = ax.gridlines(draw_labels=True,
    dms=True,
    x_inline=False,
    y_inline=False,
    linewidth=0.25,
    color="black",
    alpha=0.25,
)

# Manipulate latitude and longitude gridline numbers and spacing
gl.top_labels = False
gl.right_labels = False

"""
위경도 표시하기
요청한 위경도 범위에서 2도 간격으로 적어준다.
"""
gl.xlocator = mticker.FixedLocator([110, 112 , 114, 116, 118, 120, 122, 124, 126, 128, 130, 132, 134]) #경도
gl.ylocator = mticker.FixedLocator([25, 27, 29, 31, 33, 35, 37, 39]) #위도

gl.xlabel_style = {"rotation": 0, "size": 12}
gl.ylabel_style = {"rotation": 0, "size": 12}

#저장
plt.savefig("/content/gdrive/My Drive/noaa/ko_Jeju" + ".png",
    format="png",
    bbox_inches='tight',
    pad_inches=0,
    dpi=900
)
결과이미지
참고
'Python' 카테고리의 다른 글
| hls 영상(확장자 .m3u8) vlc player로 재생하기 (0) | 2023.08.21 |
|---|---|
| 정말 간단한 등고선 예제 (0) | 2022.12.12 |
| 파이썬 모듈 설치 관련 에러 최소화하는 법 (1) | 2022.12.08 |
| 맥에서 주피터 노트북이 실행되지 않는 경우 (0) | 2022.11.21 |

